Table of Contents
One of the best ways to make your business more popular is to use infographics design. It has been used in content marketing plans for years and is still popular.
They are creative and very good representations of the business philosophy which you should try to convey. It’s like summaries thousand words in just a picture.
Infographic maker know that 90% of information your brain receive is visual form. so it’s very easy to understand and short form of communication also.
See below cool infographics and I am sure you can easily remember and understand this.
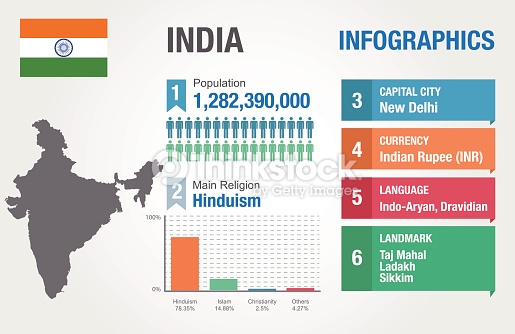
All of the elements will help you talk about your business in a way that people are able to understand better. To know about the role of infographics in your content marketing plan, give this post a good read!
How can you design infographics?
In order to design infographics, you have to use images, statistics, icons, drawing and colours of all kinds. Apart from that, you have to use brief text regarding the business.
In designing infographics, the elements and texts have to be presented in a way that is precise. The aim here is to show that the message and statistics are used in visual manner.
There are several sites like Designhill which can work well when it comes to creating infographics designs. You may take some help from professionals as well.
Here are a few reasons that can help you convince your business partners to add infographics in the content marketing plan.
Why you should use Infographics design
1. Infographics are known for better visual appeal : Most studies have shown that around 8% of information that is sent to the brain happens to be visual. The attention span of people who watch your content is not always that long.
2. People want to share them – More creative infographics more share : Infographics design are also a very interesting and easy way to boost your content marketing. They are also very much likely to share a lot of articles and blogs if it comes with a lot of infographics instead of essays and articles that are too lengthy. You can also check Neil Patel post on how to double traffic using infographics.
Note- On average, companies which start using infographics grow 12% faster than before. Experts have also revealed that the blog that features infographics get 45% more click then other.
3. Builds awareness of the brand : The infographics used are very effective as marketing tools when it comes in building better brand awareness. This is because visuals can be used in content which can convey the business message towards the audience very easily. Human brain process visual information 60,000 time faster than text.
In short, infographics design are successful as you know that no brand will be misleading the information whatsoever.
List of Infographics design tool
Founded with an intention of helping students to understand the course but ended up being one of the most powerful and easy to use infographics tool.
The application is free to almost free to use and with only a few elements like icons and images for sale. It has a huge database of free infographics templates for a person to choose from.
Visme is super cool infographic maker and It enables you to make more stuff than just infographics. Its basic version is free to use whereas you need to have a $7 subscription if you want to use the upgraded one. Working to make infographics in visme can be fun.

It’s all together at a different level of infographics, it helps in creating an ‘infographic resume’. It connects with platforms like marketing tools to generate information automatically for your resume. You can choose from themes to suit your resume needs. The service is free at all its stages. And is easy to be used.
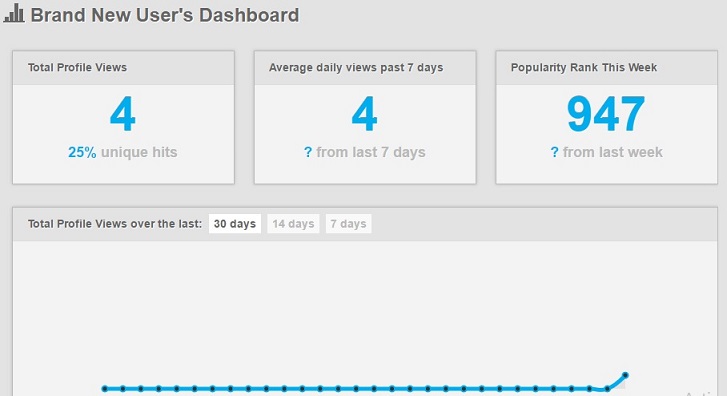
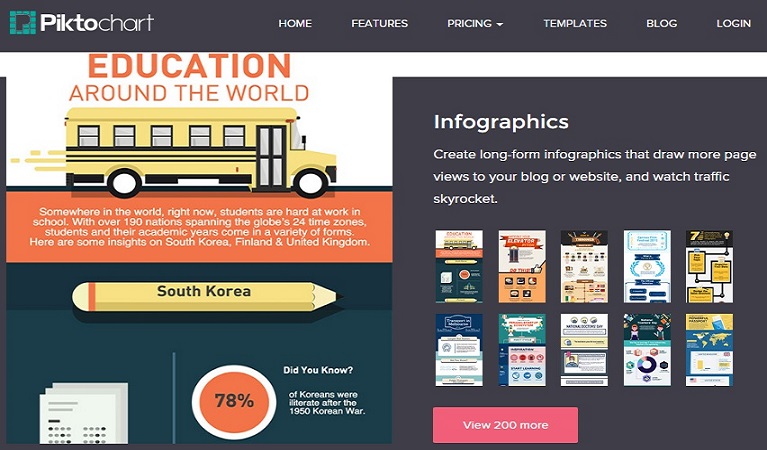
4. Piktochart – Presentation & infographic maker
Yet another suitable alternative to create various types of infographics. Again, at the novice level its free to use but if you want to use the premium version you must enroll yourself for a monthly subscription of close to $15. The premium version has certain better templates and techniques to frame infographics.
Here, choices are available for formats, including a tall and thin infographic size, slide decks for PPT’s, displays and reports.
Once you have chosen your desired template you just simply need to drag and drop graphic elements and texts to your canvas. And viola your infographics is ready.
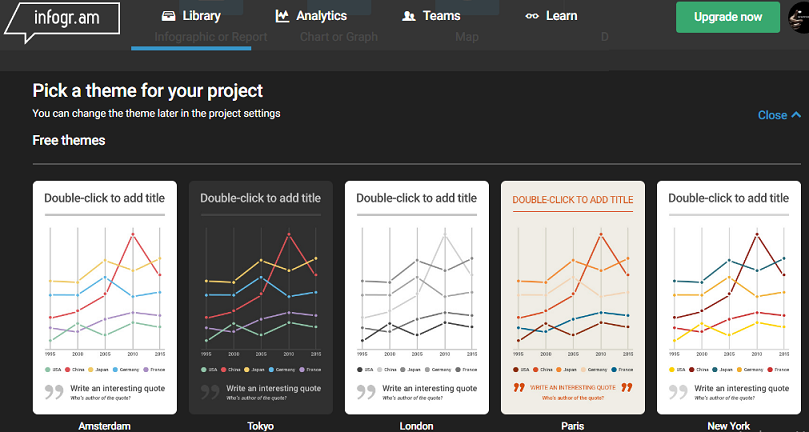
Infogr.am offers easier infographics templates for usage. After you have made your choice of template, one can edit the content of the page. Its specialty is its ease of dealing with statistical data.
It’s free at the base version, with a $15 subscription for its upgraded one. Infogr.am however, as per blogs is a level up in usage than the other options mentioned earlier.
It’s a very user-friendly product and as per different blogs, even a kid can operate it. It’s almost free to use with the pro account coming for a small subscription fee of $3 per month.
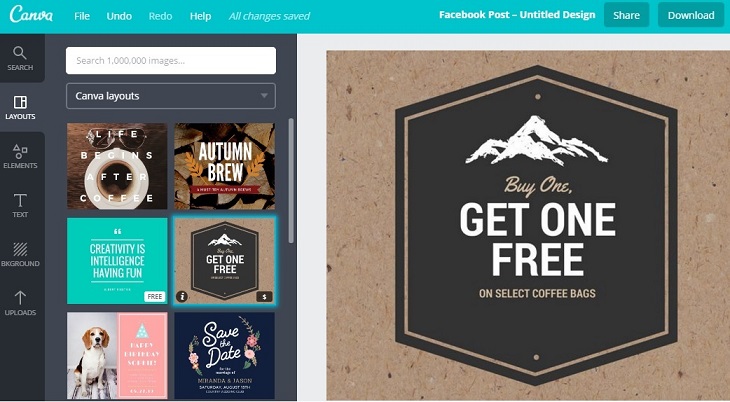
As soon you arrive on their main page, the only thing you need to do is to choose from their many templates or simply ‘start fresh’. They have a template library providing with certain very apt ones for subjects or topics.
When you have found the desired template, your will be directed to customize your infographics design as per your requirement. They have their basket filled with infographic tools like tables, charts, backgrounds and more.
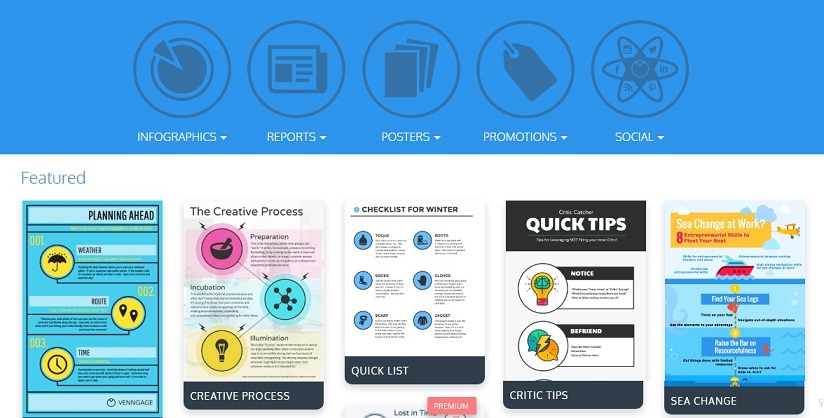
A product very like Canva, Venngage provides us with some different alternatives to choose from respective of our criteria. Here, we can choose free infographics templates for options like reports, infographics, advertisement, display and others. Its free to use but if you want to use the upgraded version with more tools, you must take a $15 per month subscription.
Once you have found the template it allows you to insert widgets which includes things like charts and structures you have for your infographics.
If we browse through the infographics section, we can find additional options that help us to cater your precise needs and sections of data. Like, analytical, informational, method, difference, knowledge, geographical.
Other infographics tools
- vizualize.me
- infogram.com
- icharts.net
- Google chart
- infoactive.co
- creately.com
- chartsbin.com
- gliffy.com
- designcap.com
Conclusion on role of infographics in content marketing plan
The main prerogative of representing data is to display information in a very organized and neat manner. The human nature is subjective whenever it comes to reading data as well as information. By using the right infographics design, there will be a much lesser chance of misinterpreting the figures and facts.
Also by using data analytics, the infographics will also make data much enjoyable and simple. The designers that choose to make new infographics using elements which are smoother to hold and very easy to hold.
You can choose colours or shapes of your choice to make data more appealing. It will also educate the viewers. One must start a very effective infographic which will demand better skills and even more creativity.

